SOP ID ▸ PPP-007 | Lease Expiration Bar Graph | v1.0
| Parent SOP | BMM-Fin-PPP v1.0 |
| Owner (R) | Property Manager |
| Accountable (A) | Regional Manager |
| Next Review | 2026-03-31 |
| Typical Duration | ≤ 3 min (report packet pre-printed) |
| Related WIs | PPP-006, PPP-008 |
PPP Lease Expiration Bar Graph — Data Transfer
Task Objective
Use the Lease Expiration Bar Graph to capture Actual Lease Renewals for the current and next five months, and flag any month where Actual Expirations exceed the Max Allowed limit.
1 Prerequisites / Tools
| Report Packet | Lease Expiration Bar Graph (12-month horizon, correct property) |
| Workbook | PPP open to current month tab |
2 Step-by-Step Instructions
Verify property & date range.
Header shows correct Property, Fiscal Period = current month, and As-Of date = today. Graph must cover the next 12 months.
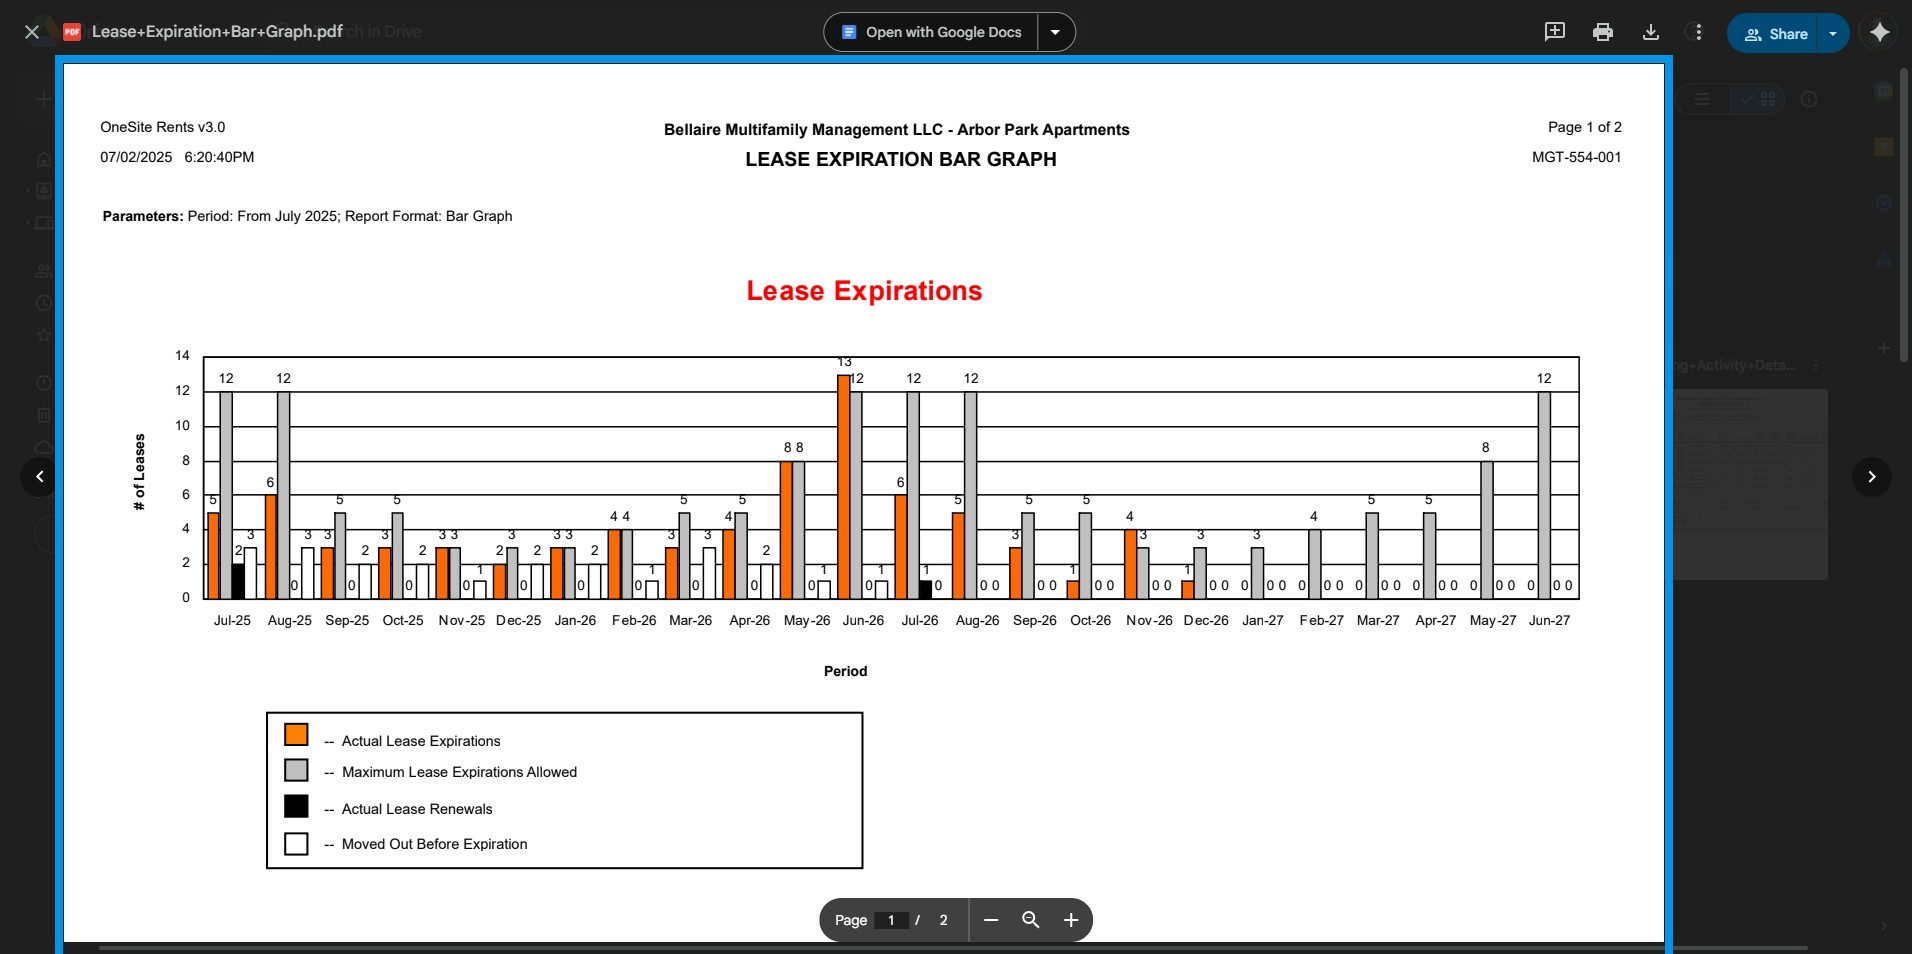
Understand bar order & colors.
For each month (left → right):
① Actual Expirations (blue)
② Max Expirations Allowed (red limit line)
③ Actual Renewals (black bar)
④ Moved-Out Before Expiration (gray)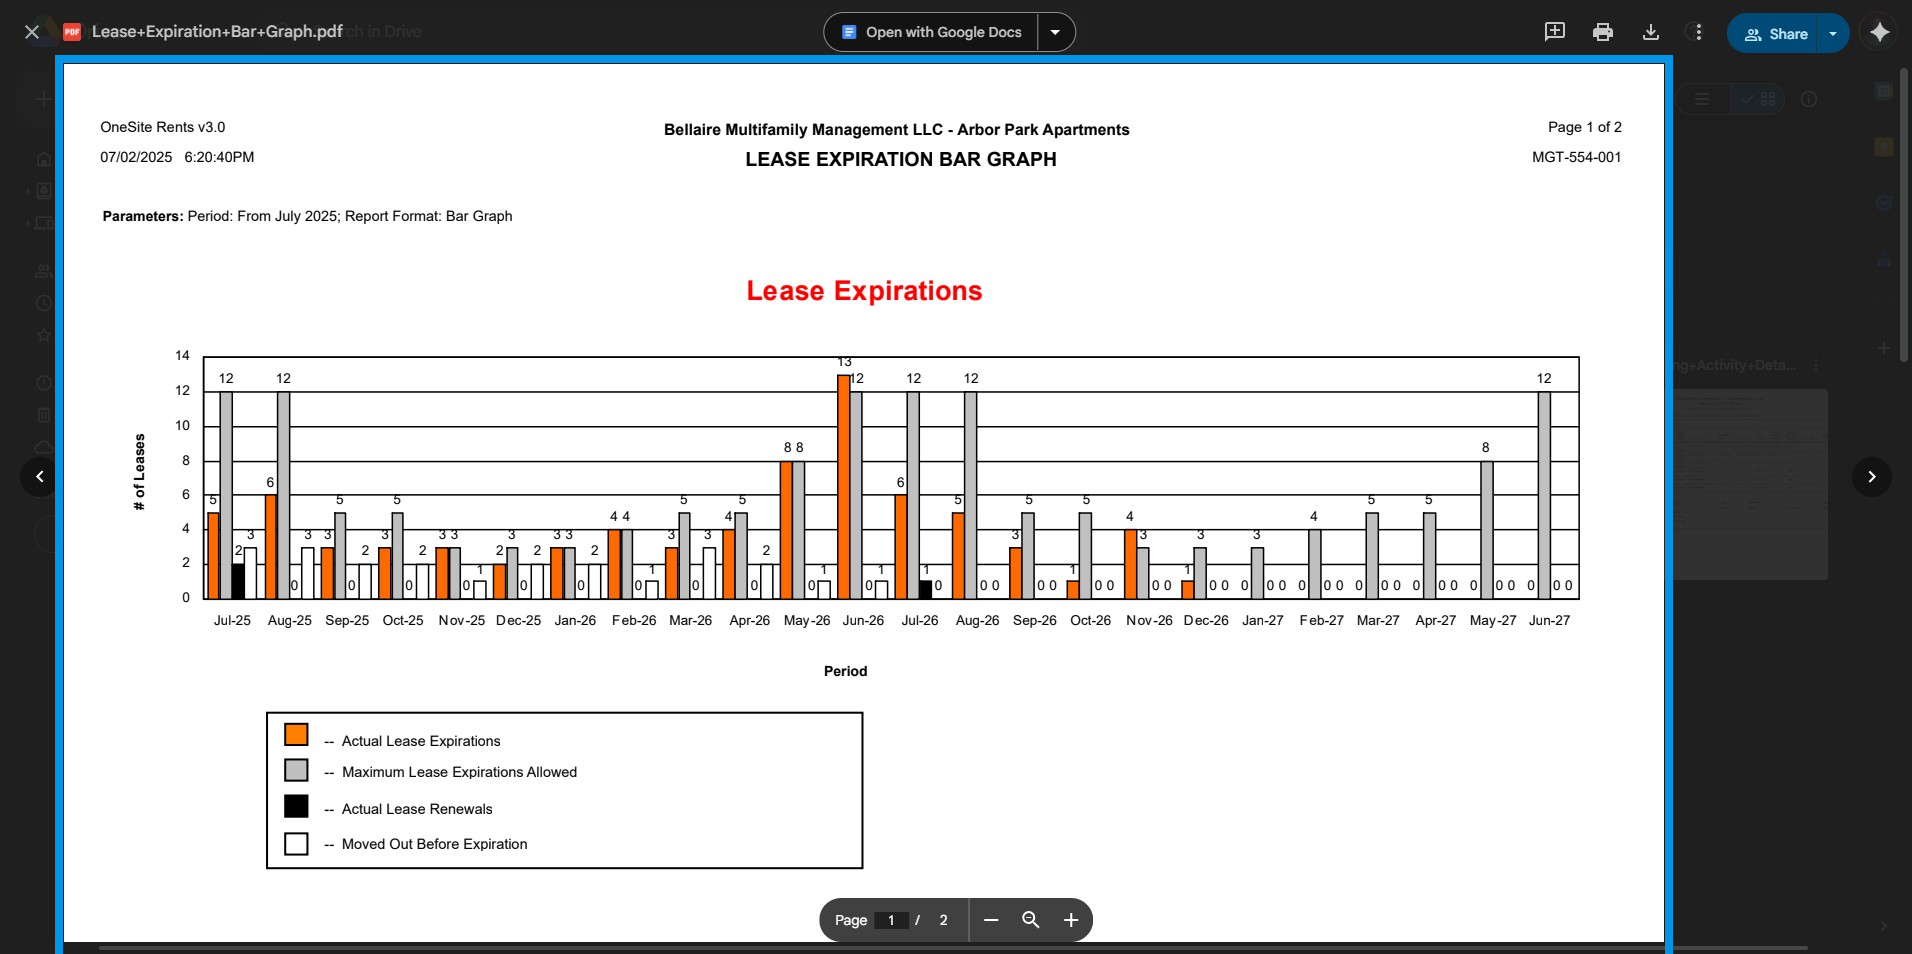
Identify Actual Renewals (black bar).
Note the black bar height for the current month + next five months. These are the totals you will transfer to PPP.
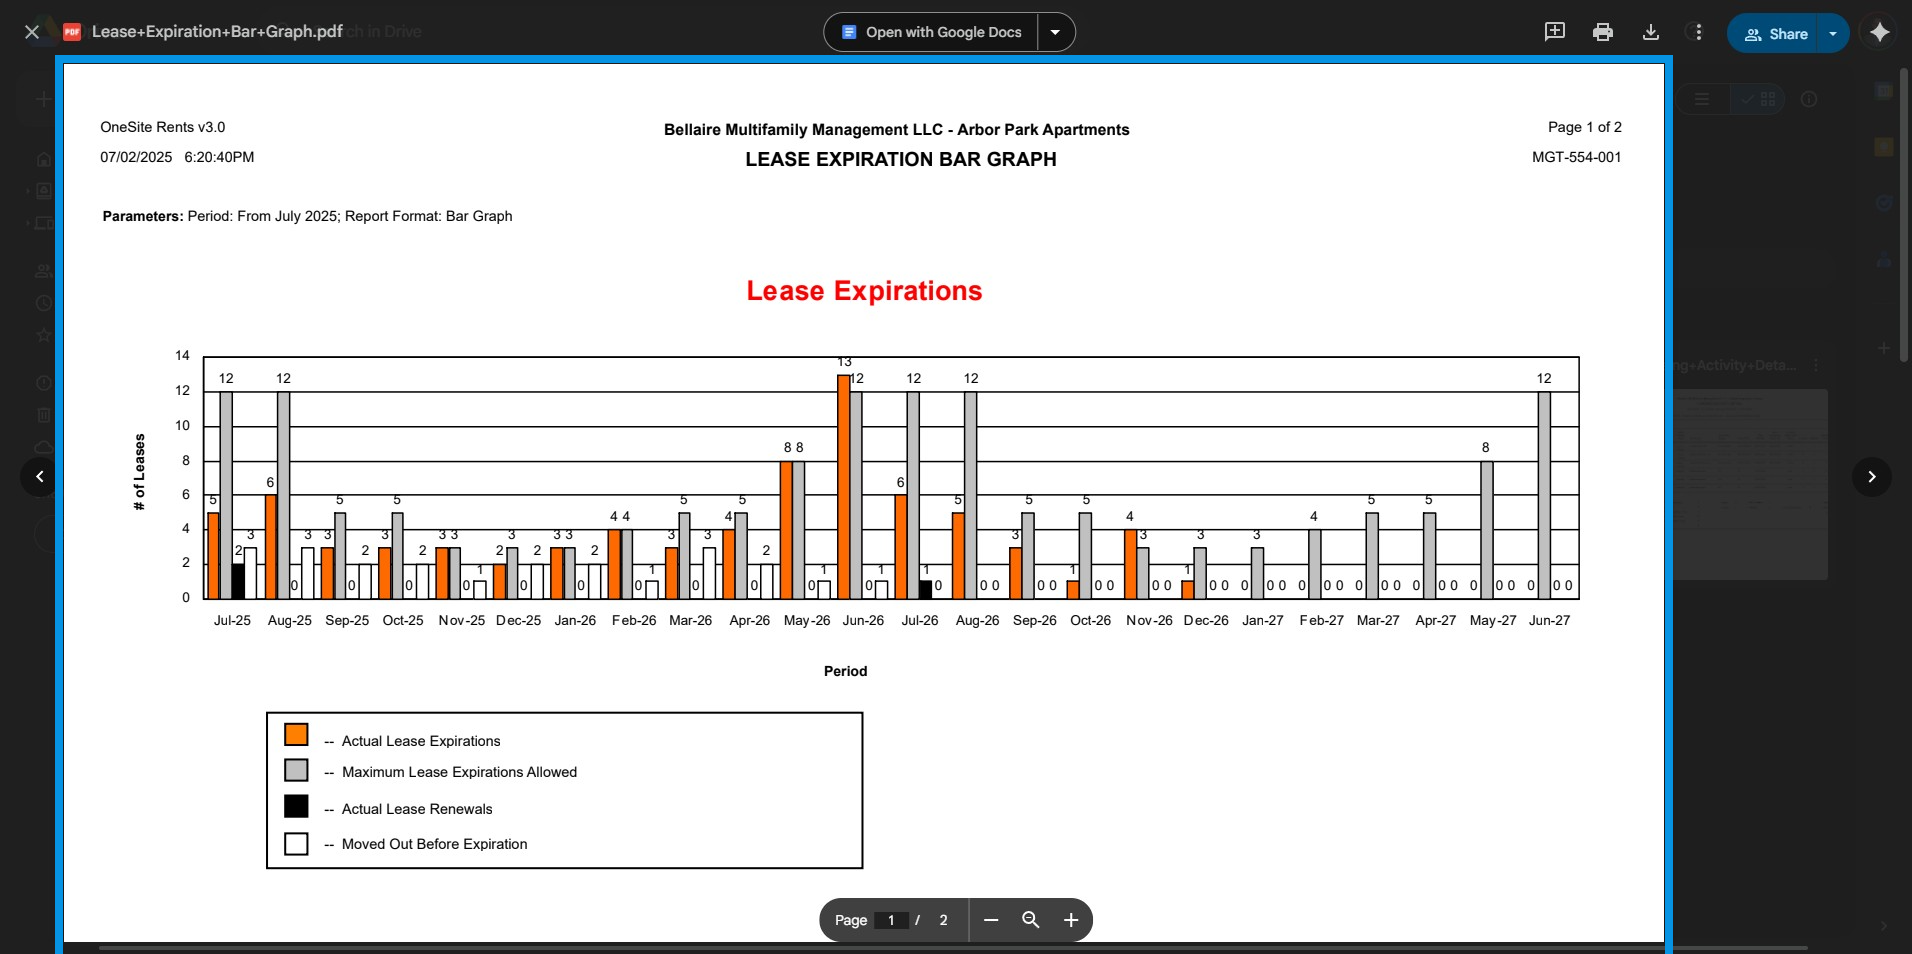
Compare Actual Expirations vs. Max Allowed.
If any blue bar exceeds the red limit line for a month, flag the variance to your Regional Manager.
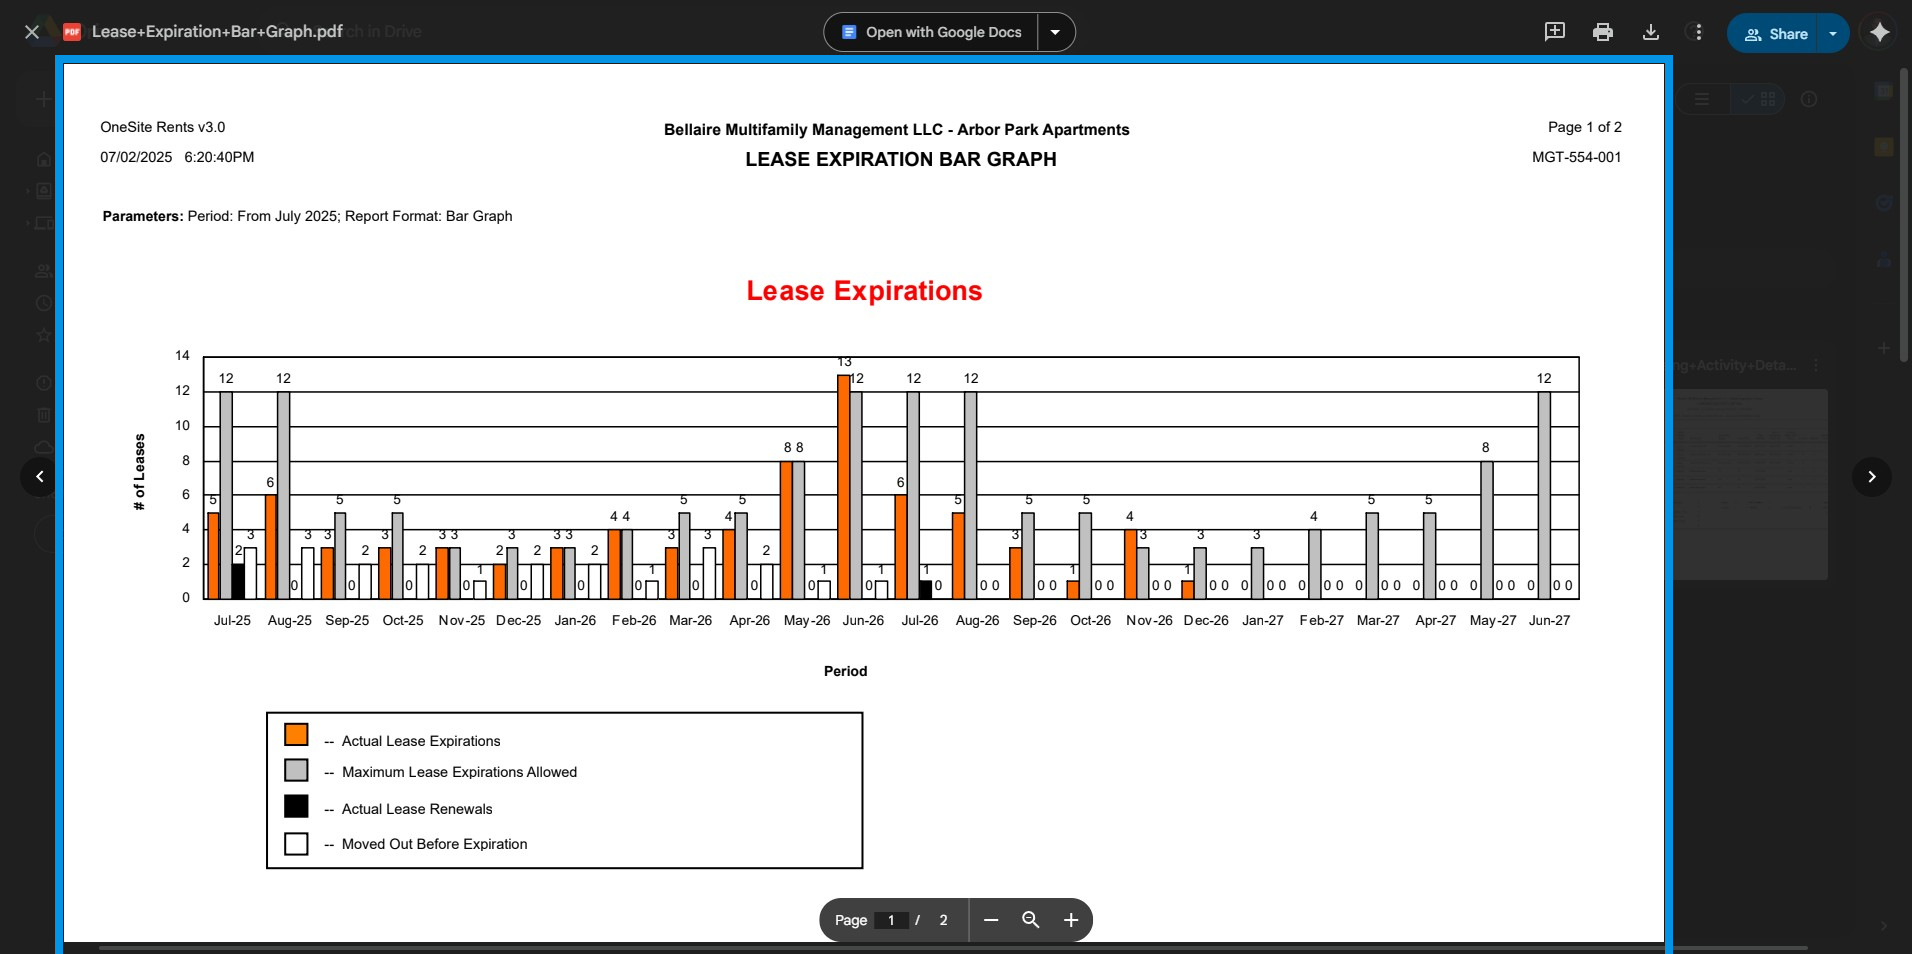
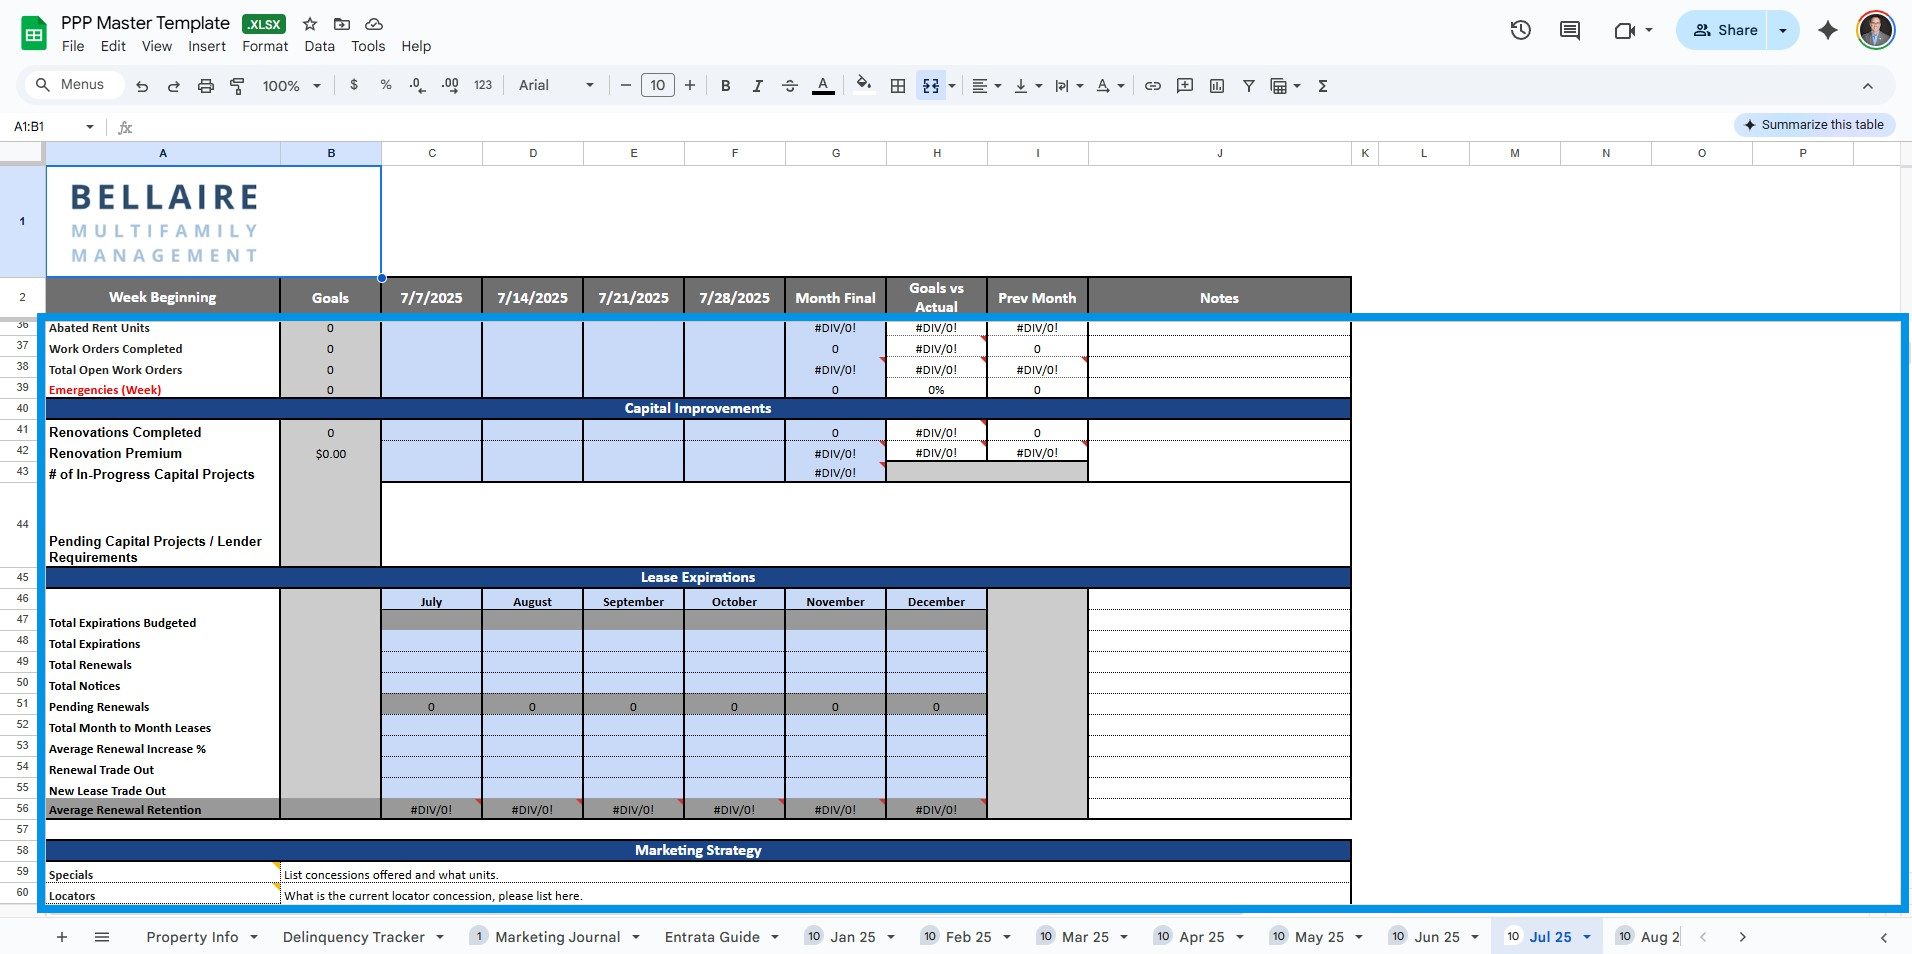
Enter Renewals totals in PPP.
In PPP row Actual Lease Renewals, overwrite last week’s numbers with this week’s totals for each of the six months.
3 Escalation & Support
| Blue > Red limit variance | Email RM with month & count. |
| System error / report unavailable | Submit Help-Desk ticket ➜ notify RM. |
4 References
| PPP Playlist – All Steps |
| Next WI ➜ Maintenance Review (PPP-008) |
5 Revision History
| Date | Ver. | Description | Author |
|---|---|---|---|
| 2025-09-08 | v1.0 | Initial release | S. Rea |
Was this article helpful?
That’s Great!
Thank you for your feedback
Sorry! We couldn't be helpful
Thank you for your feedback
Feedback sent
We appreciate your effort and will try to fix the article